Mục lục bài viết (7)
- What is Foot Traffic Data and Why is it More Important Than Sales?
- How to Collect Accurate Foot Traffic Data?
- Analyzing POS and Foot Traffic Data: Core Metrics
- Comparison Table of Foot Traffic Data Collection Methods
- Analyzing Foot Traffic Data to Optimize Staffing and Work Schedules
- Heatmap Analysis to Optimize Product Display
- Common Mistakes When Analyzing Foot Traffic Data
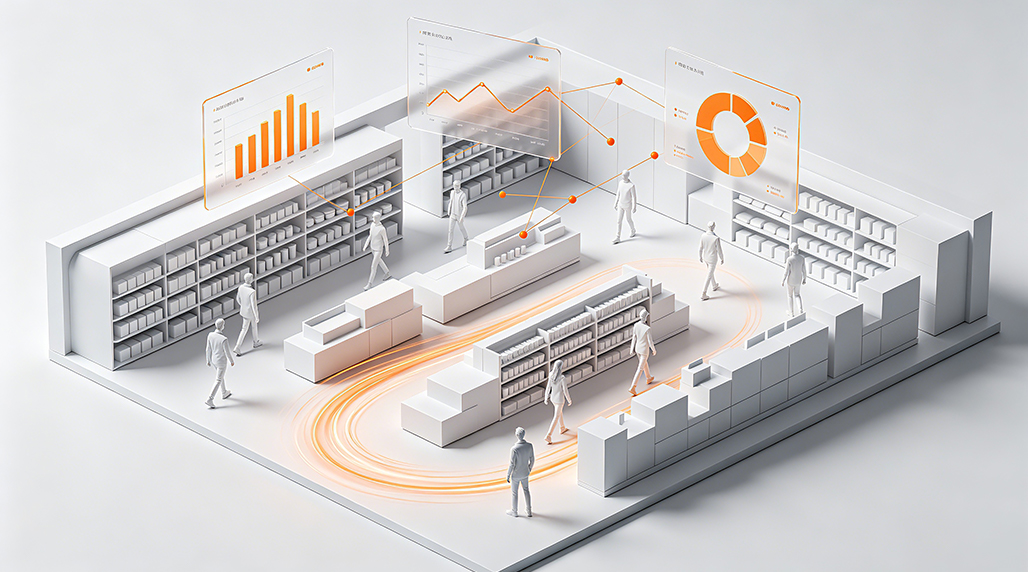
Foot traffic data is a collection of information about the number of people entering and exiting a store, their dwell time, and movement behavior within the retail space. When combined with transaction data from POS systems, businesses can shift from guesswork to decisions based on actual metrics. According to a McKinsey report, retail chains that apply foot traffic analytics can increase revenue by 15-25% and reduce operating costs by 10-20% within the first 6 months.
What is Foot Traffic Data and Why is it More Important Than Sales?
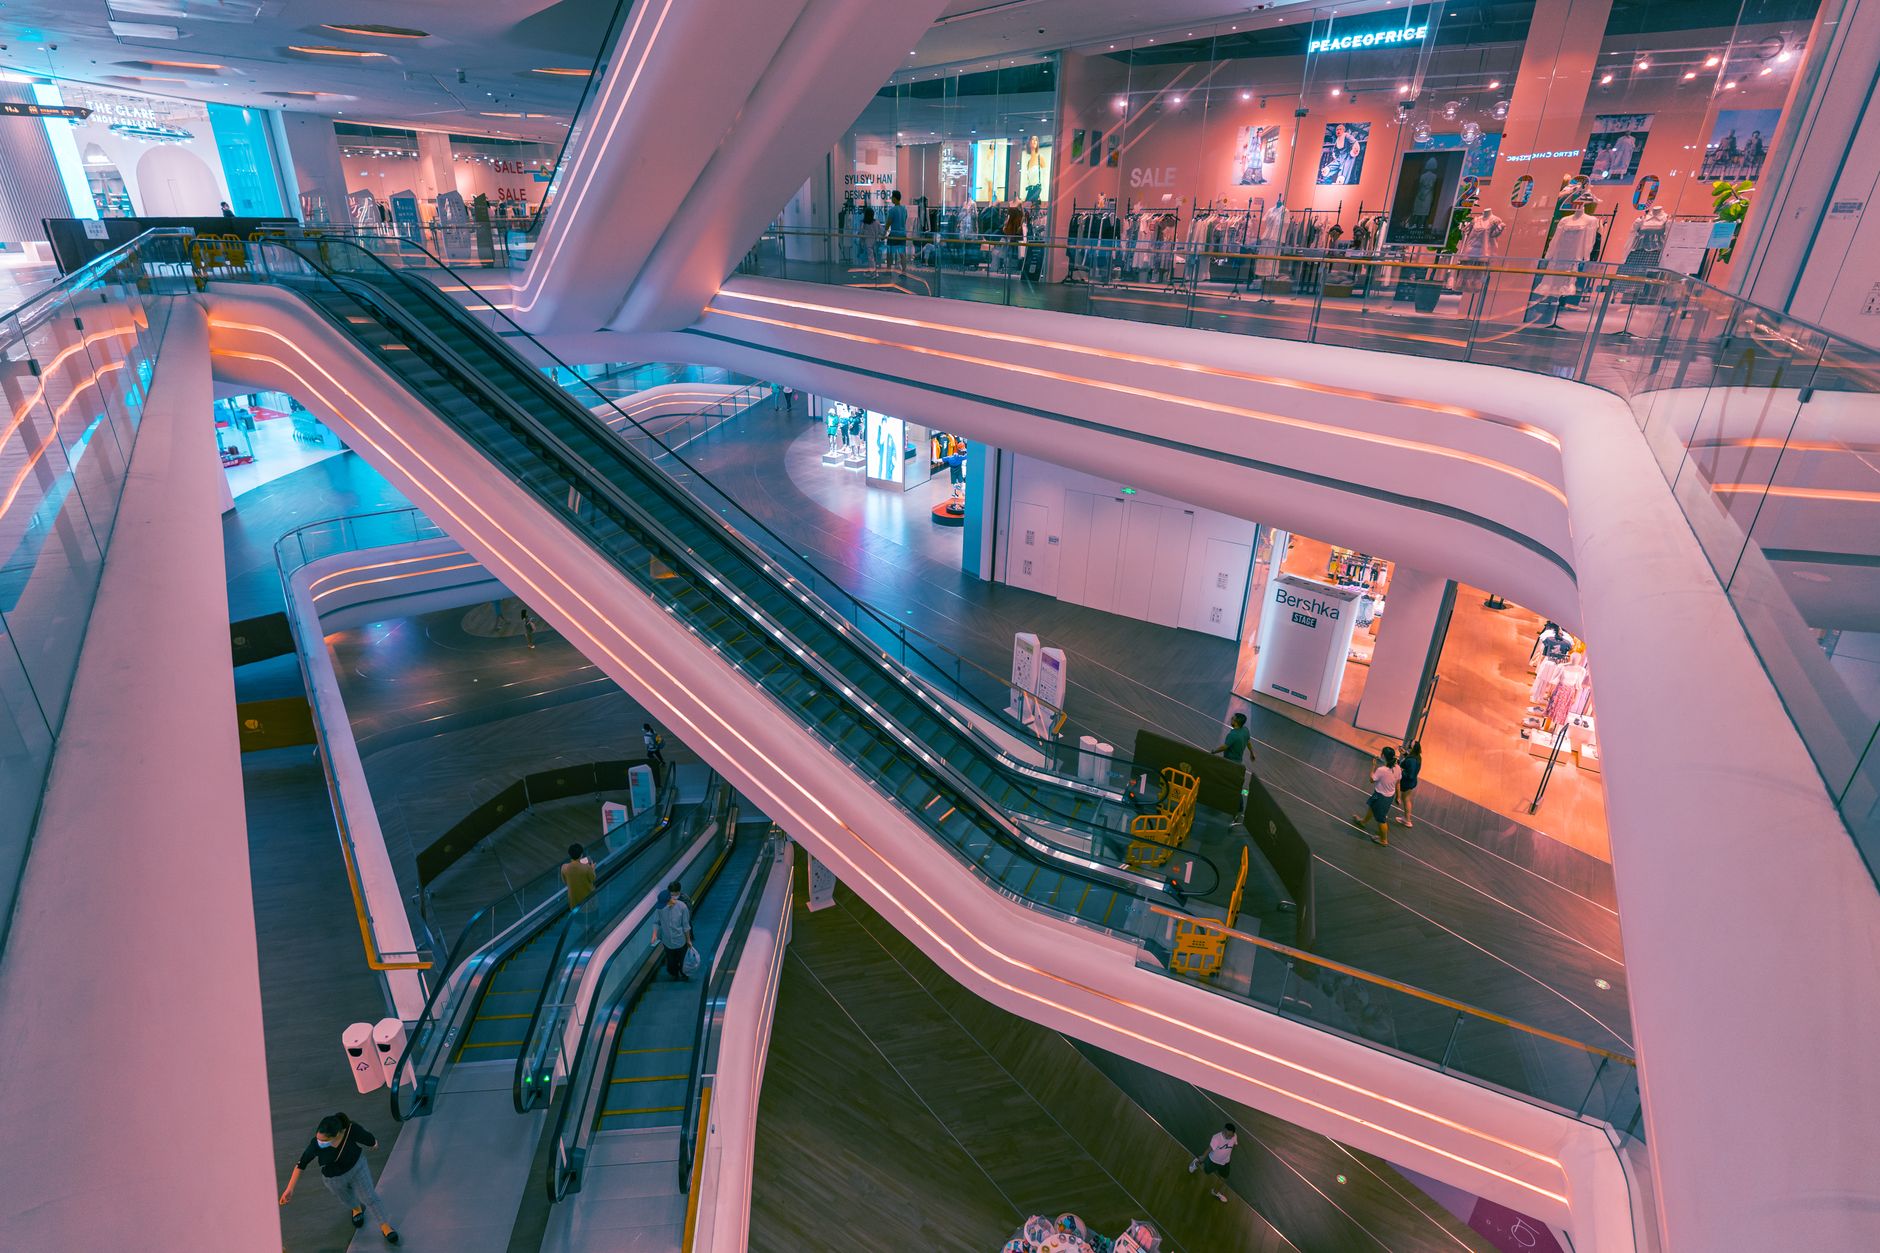
Foot traffic data is the actual number of people entering your store within a specific period. It is more important than sales because sales only show you the outcome, whereas foot traffic reveals the causes and opportunities. Knowing how many people enter your store allows you to calculate conversion rates, optimize staff schedules, and adjust display strategies.
Many retail business owners in Vietnam only look at end-of-day sales. They are unaware that a day with high sales but low customer traffic could indicate selling high-value items while missing cross-selling opportunities. Conversely, a day with high customer traffic but low sales points to issues with conversion rates or pricing. Foot traffic data helps you distinguish these two situations and make accurate decisions.
How to Collect Accurate Foot Traffic Data?
Related Products


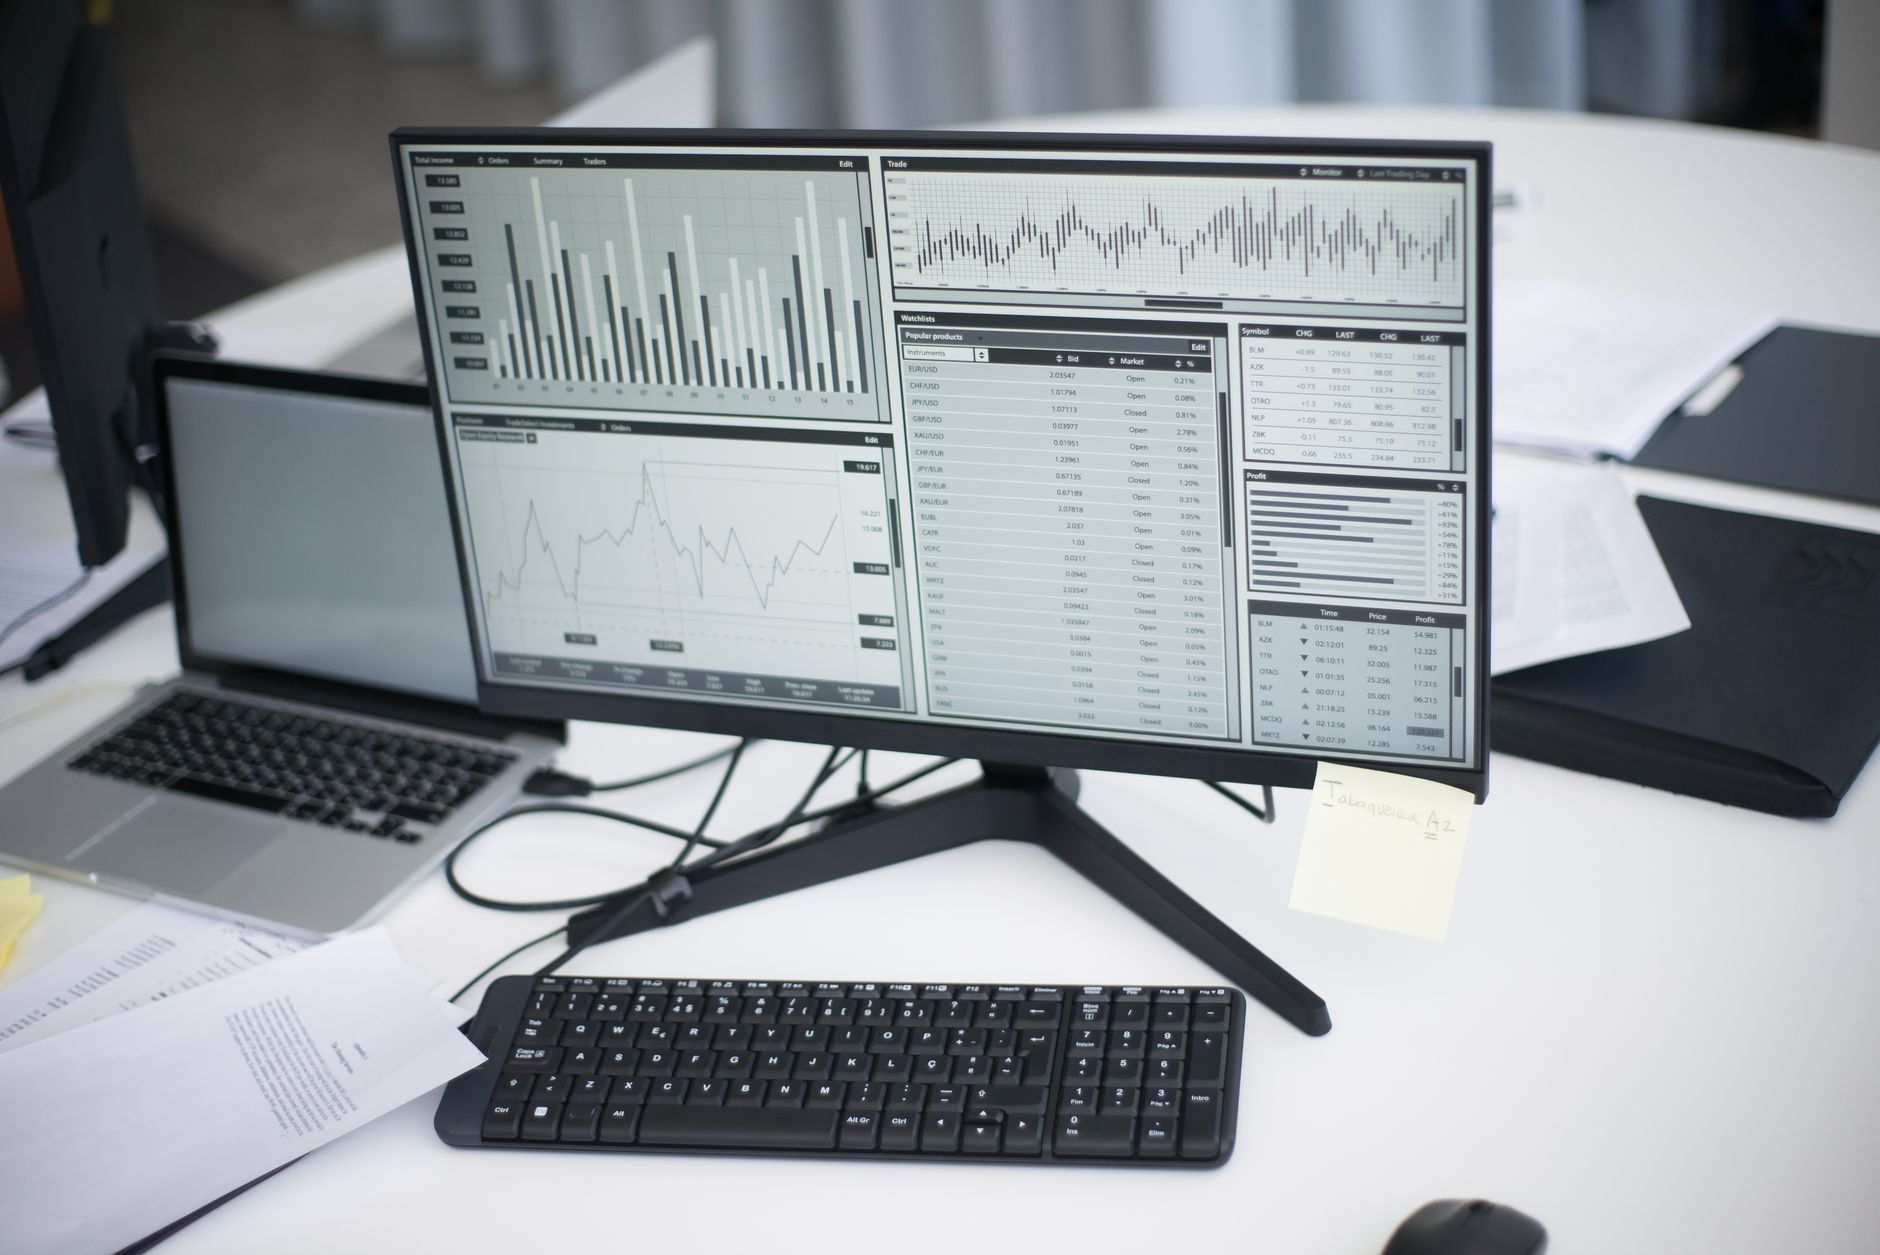
There are three main methods for collecting foot traffic data: infrared (IR) sensors, 3D AI cameras, and Time-of-Flight (ToF) sensors. Each method offers different accuracy and cost. 3D AI cameras are currently the most accurate solution, achieving 95-98% accuracy under normal lighting conditions, while IR sensors have 80-90% accuracy but at a lower cost.
For small and medium-sized retail chains in Vietnam, Việt Đức Trí Group recommends using 3D AI cameras or ToF sensors because they are easy to install, do not require infrastructure changes, and can integrate with existing POS systems. Devices like the HX-CCD23 or FP221 Series are suitable for retail environments with an investment cost under 10 million VND per measurement point.
Analyzing POS and Foot Traffic Data: Core Metrics
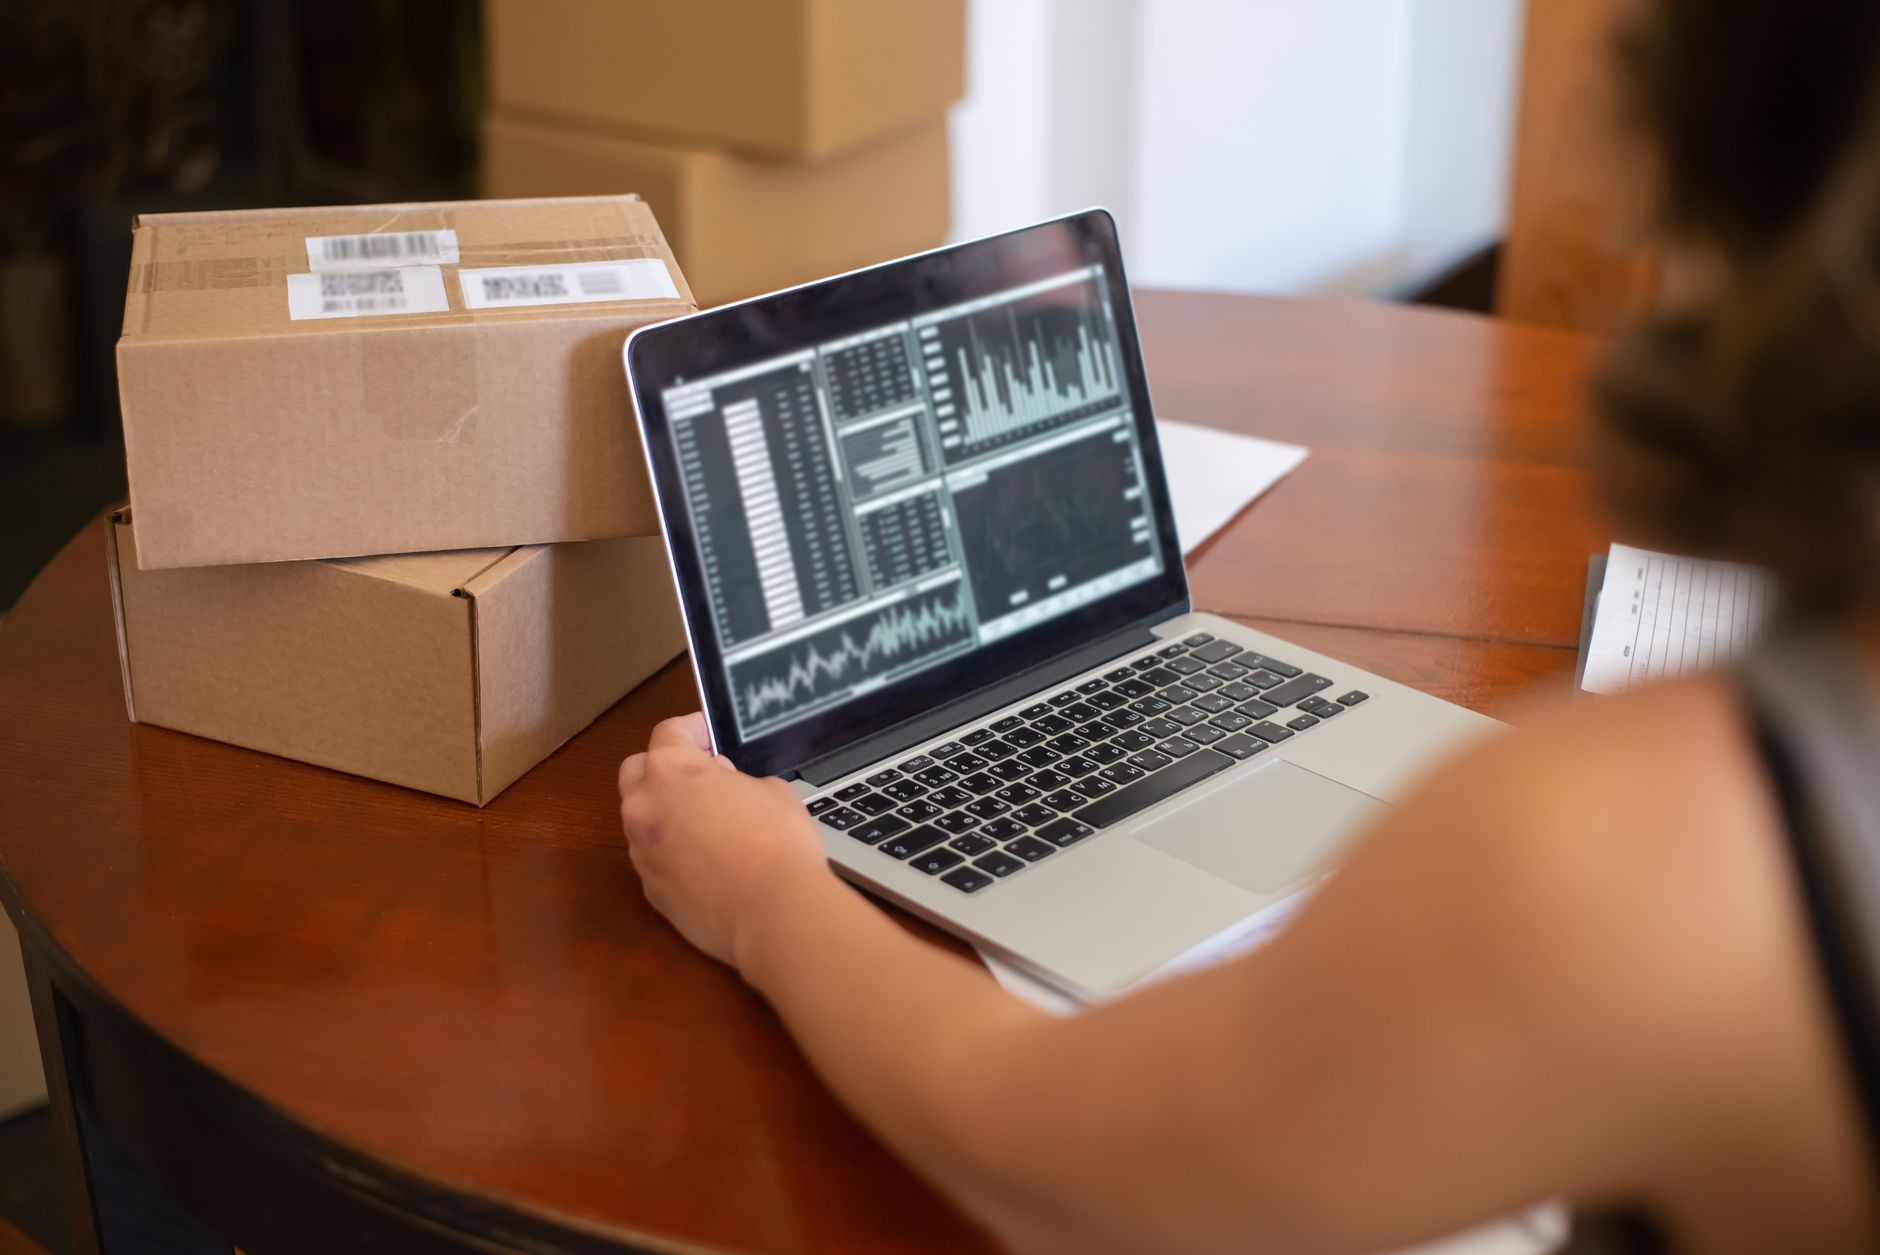
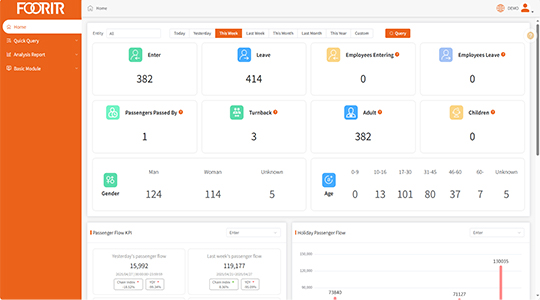
There are four core metrics when combining POS and foot traffic data: Conversion Rate, Dwell Time, Outside-to-Inside Ratio, and Heatmap analysis. Each metric provides a different perspective on store performance.
Conversion Rate
Conversion Rate = (Number of Transactions / Number of Visitors) × 100%. If your store has 200 visitors but only 20 transactions, the conversion rate is 10%. This metric indicates the effectiveness of sales staff and product displays. A retail chain in District 1, Ho Chi Minh City, after applying this analysis, found that the conversion rate increased from 12% to 18% on days with permanent staff instead of temporary staff. They adjusted work schedules and increased revenue by 15% in the following month.
Dwell Time
Dwell time is the average amount of time a customer stays in the store. By analyzing data from AI cameras and sensors, you can identify bottleneck areas or areas where customers linger the longest. For example, a convenience store in Da Nang discovered that customers often got stuck in the coffee machine area, causing them to bypass other shelves. After moving the coffee machine to a separate area, dwell time increased by 30%, and consumer goods sales in that area rose by 12%.
Outside-to-Inside Ratio
This metric compares the number of people passing by the store with the number of people who actually enter. If 1,000 people pass by but only 100 enter, the ratio is 10%. This is a direct measure of the storefront's attractiveness. A real-world experiment showed that changing the facade lighting from white to high-contrast blue lights could increase this ratio by 15-20%. You can test this by changing lighting, signage, or window displays for a week and comparing data from people-counting devices.
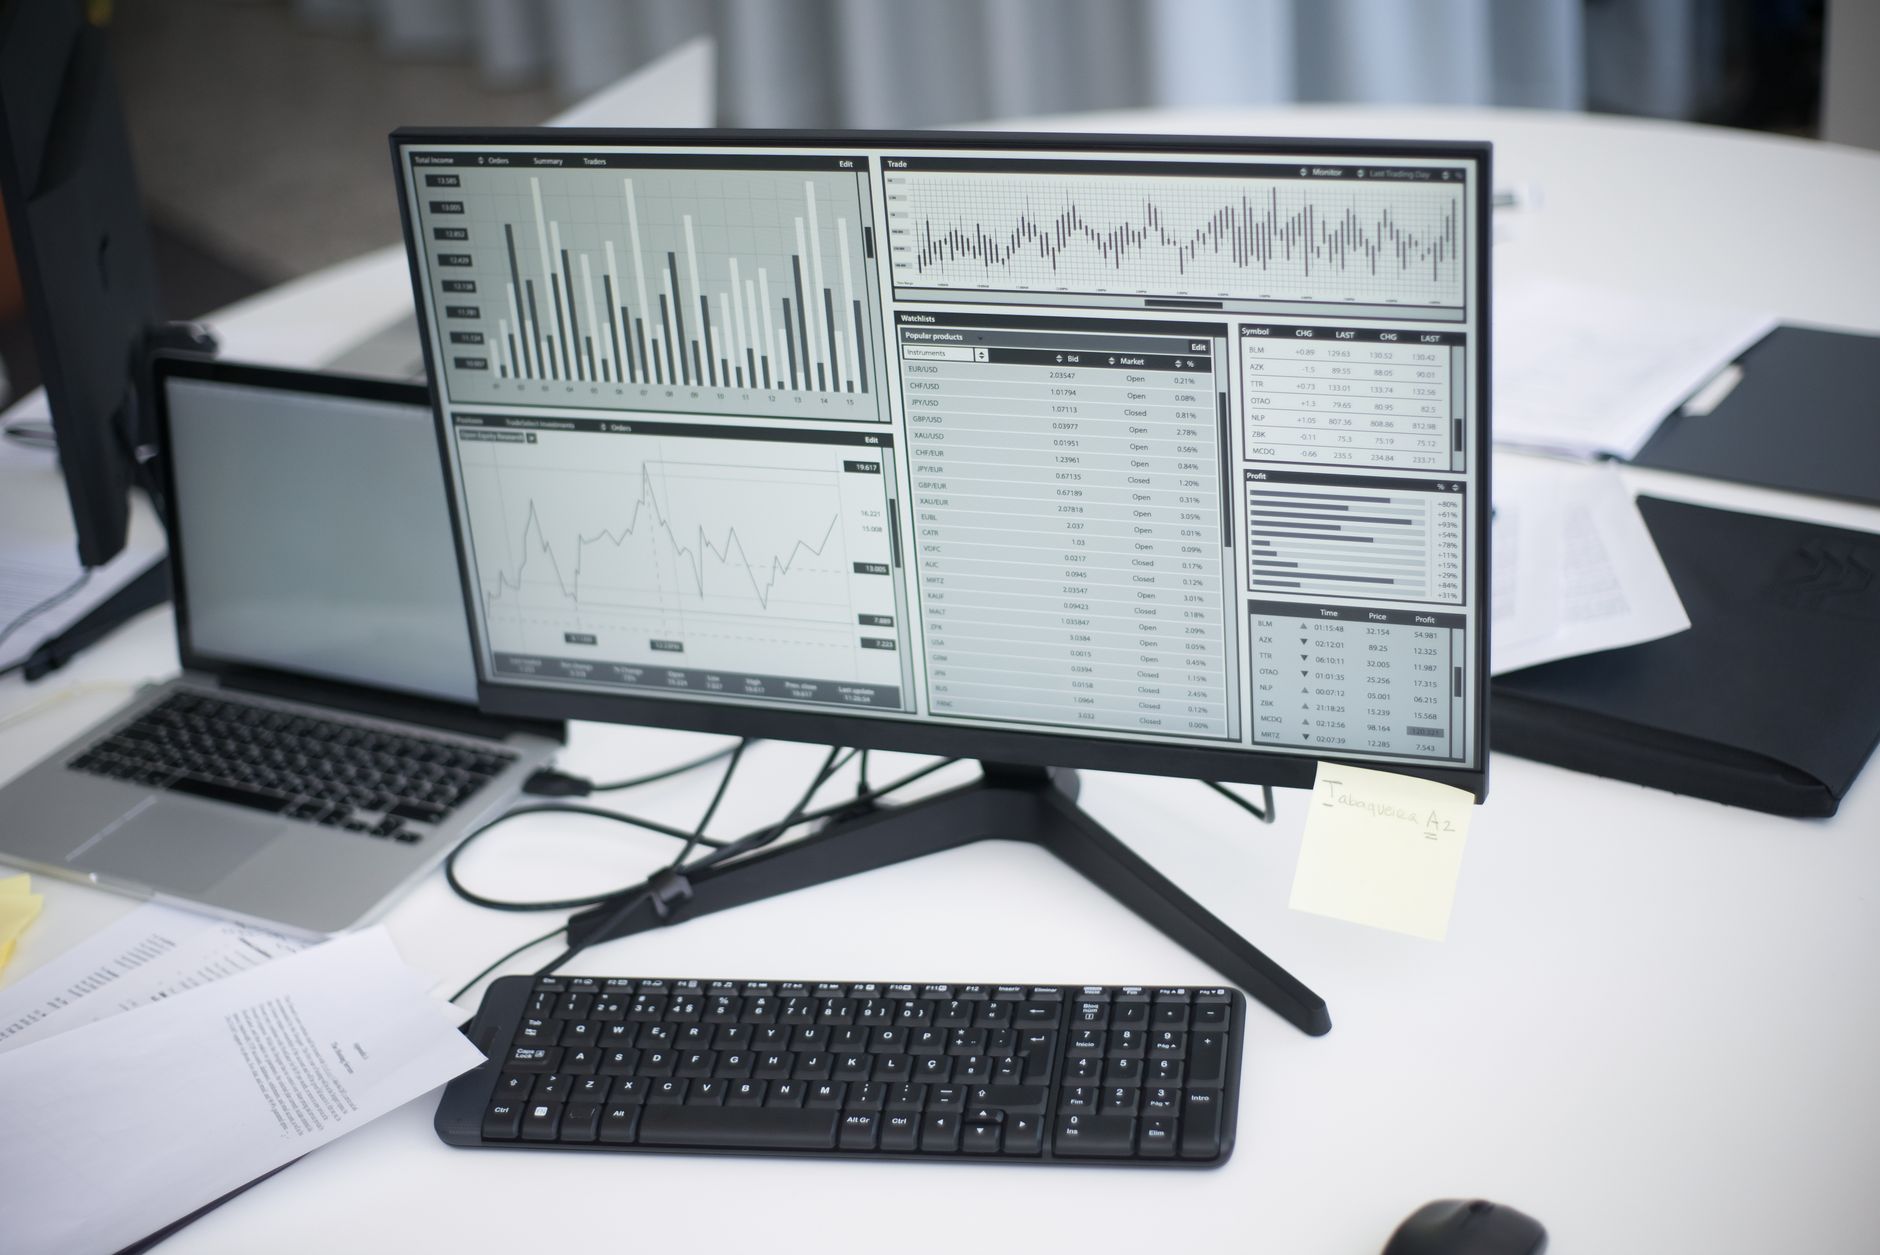
Comparison Table of Foot Traffic Data Collection Methods
| Method | Accuracy | Cost (VND) | Advantages | Disadvantages |
|---|---|---|---|---|
| Infrared (IR) Sensor | 80-90% | 2-5 triệu | Easy to install, not affected by light | Cannot distinguish adults/children, prone to errors in crowded conditions |
| 3D AI Camera (Stereo Vision) | 95-98% | 8-15 triệu | Distinguishes people, accurate counting, prevents double-counting | Requires sufficient lighting, needs initial calibration |
| Time-of-Flight (ToF) Sensor | 93-97% | 6-12 triệu | Works well in low light conditions, high accuracy | Higher cost than IR, requires stable power supply |
| Wi-Fi Sniffer (BSSID) | 60-75% | 1-3 triệu | Low cost, can track returning customers | Low accuracy, dependent on mobile devices |
Note: The costs above are for reference in the Vietnamese market in 2026, not including installation and POS integration fees.
Analyzing Foot Traffic Data to Optimize Staffing and Work Schedules
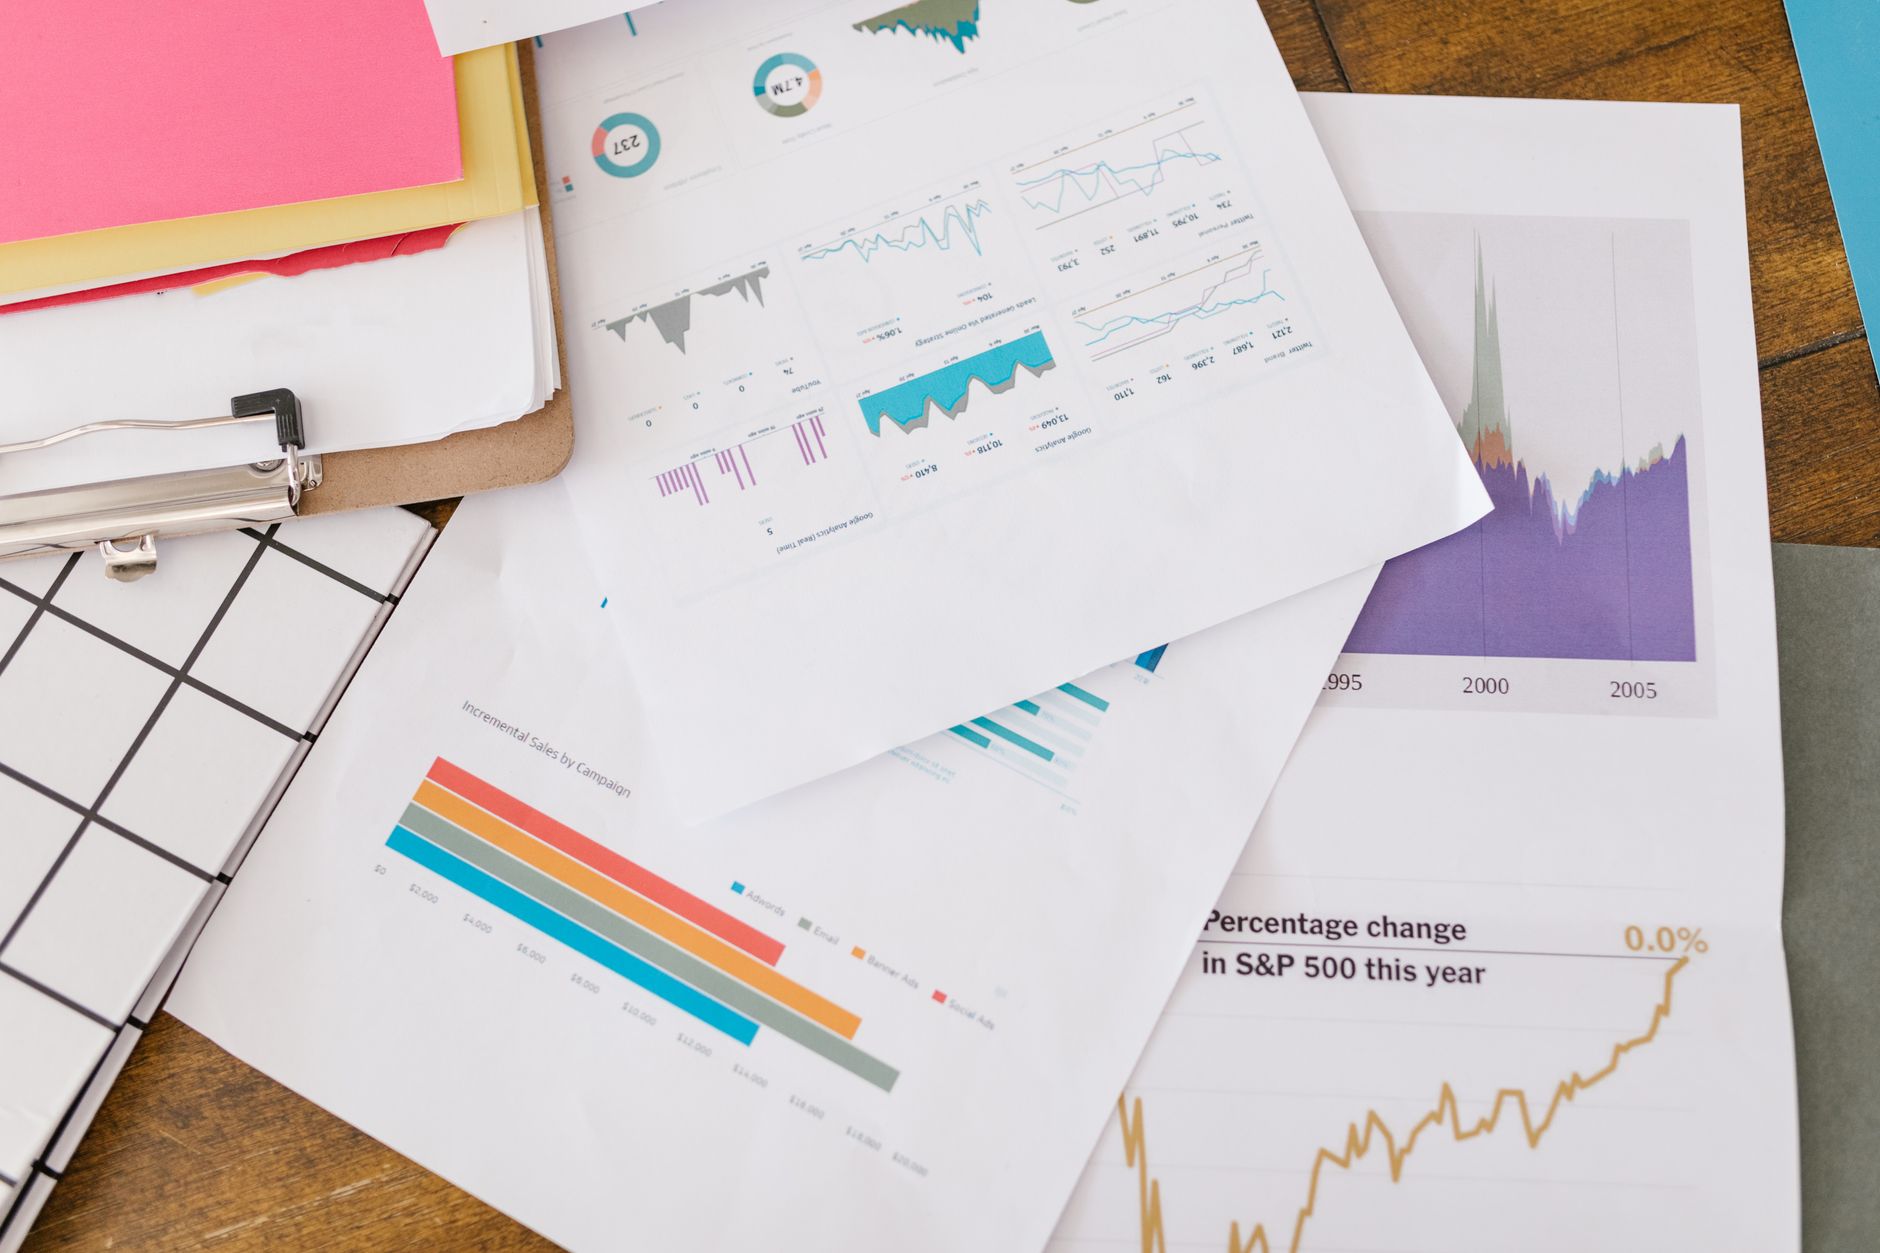
Hourly foot traffic data allows you to accurately schedule staff. Instead of relying on intuition, you can allocate personnel to peak hours and reduce staff during off-peak hours, saving 10-15% in labor costs without affecting customer experience.
For example, a mini-supermarket chain in Hanoi discovered that customer traffic surged every Wednesday from 14:00-15:00 due to a nearby bus stop. They adjusted their work schedules, assigning more cashiers and sales staff during this period, which reduced waiting times from 5 minutes to 2 minutes and increased sales by 8% during that hour. You can do similarly by integrating data from a synchronized POS system with people-counting devices for a comprehensive overview.
Heatmap Analysis to Optimize Product Display
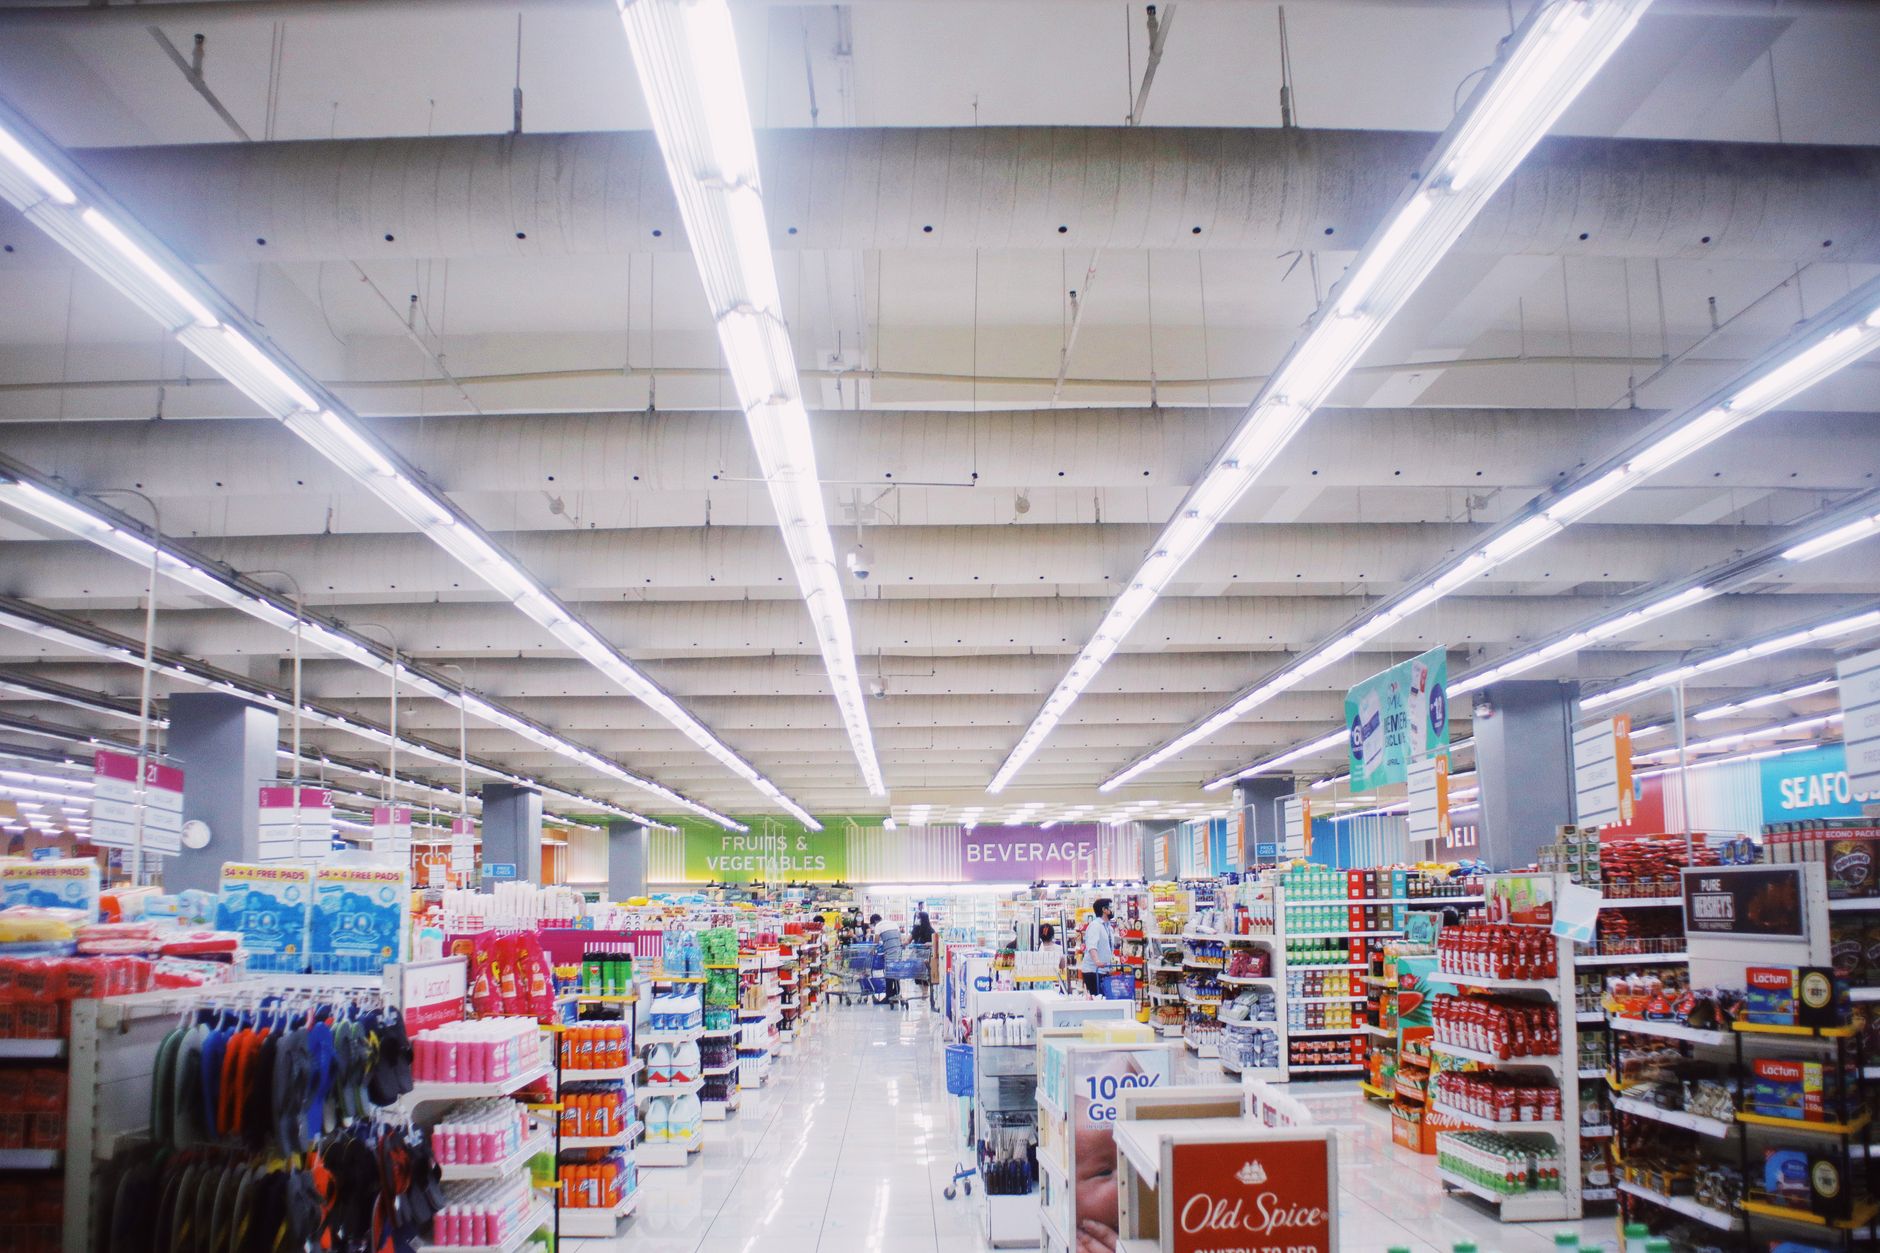
Heatmap analysis allows you to observe how customers move within the store. By dividing the floor into zones and installing sensors or AI cameras, you can identify which areas attract the most customers and which areas are overlooked.
A real-world case study from a fashion store in Ho Chi Minh City: after installing a 3D AI camera system and integrating it with POS, they discovered that the discount section at the back of the store had a high dwell time but a low purchase rate. The reason was insufficient lighting and lack of staff presence in that area. They improved lighting, assigned more sales associates, and increased sales in this area by 22% within one month. You can refer to **fashion store management** solutions to integrate inventory and foot traffic data.
Common Mistakes When Analyzing Foot Traffic Data
- Only looking at total figures without hourly analysis: Total daily foot traffic data might look good, but if 80% of customers arrive during 2 peak hours, you need to adjust staffing and displays for those specific time slots.
- Not filtering out noise data (delivery personnel, staff): If the device counts both staff and delivery personnel, the data will be inaccurate. Filters need to be set up or AI cameras capable of differentiation should be used.
- Ignoring the Outside-to-Inside Ratio: Many store owners only focus
Cần tư vấn thiết bị/giải pháp cụ thể?
Việt POS phản hồi trong 30 phút · Hotline 4 vùng · Khảo sát miễn phí.
Bài viết cùng chủ đề