Mục lục bài viết (4)
RFID inventory location and sorting is a system that uses UHF radio waves at 918.4–923 MHz (compliant with Vietnam regulations) to automatically identify and record the real-time location of goods. Unlike manual inventory checks, RFID enables warehouse operations with over 99% accuracy, reduces phantom inventory, and significantly increases picking productivity.
Invest in RFID inventory location when: (1) phantom inventory > 5%, (2) item search time > 10 minutes per occurrence, (3) picking productivity is 30% below industry standards. ROI formula: (Reduced inventory value × 15%) + (Saved labor costs) + (Increased revenue from faster picking) divided by total investment cost. Average payback period is 12-18 months.
Table of Contents
- What signs indicate your warehouse is ready to invest in RFID inventory location?
- Comparison of manual operation costs vs. RFID inventory location in warehouses
- ROI calculation formula for RFID inventory location projects
- What is the average payback period for an RFID inventory location system?
- Limitations of RFID inventory location that businesses need to know
- A-Z implementation process for RFID inventory location in warehouses
- RFID frequency and compliance in Vietnam for inventory location systems
- Frequently Asked Questions
What signs indicate your warehouse is ready to invest in RFID inventory location?
What signs indicate your warehouse is ready to invest in RFID inventory location?

Your warehouse should switch to RFID when it meets at least 3 of the following 5 signs: phantom inventory over 5%, item search time over 10 minutes per occurrence, picking productivity 30% below industry standards, shipping errors over 2%, or manual inventory costs consuming too many labor hours.
Below are 5 specific signs to help warehouse owners identify the need to invest in RFID inventory location & sorting:
- Phantom inventory over 5%: The system shows stock available, but it cannot be found in reality, or vice versa. Each occurrence costs staff 15-25 minutes to investigate, leading to delayed orders and lost customer trust.
- Item search time over 10 minutes per occurrence: For a 500-2000m² warehouse, if staff take more than 10 minutes to locate a pallet or SKU, picking productivity is being severely eroded.
- Low picking productivity: A skilled picker achieves 60-80 lines/hour. If your warehouse only reaches 40-50 lines/hour, the issue is not personnel but the location system.
- Shipping errors over 2%: A rate of incorrect SKU or quantity delivery above 2% means losing customers and incurring complaint handling costs.
- Manual inventory consuming too many hours: If you spend 2-3 days each month closing the warehouse for inventory, you are losing revenue during those days.
If your warehouse meets 3/5 of the above signs, it is time to calculate investing in an RFID system for finished goods warehouse & shipping.
Comparison of manual operation costs vs. RFID inventory location in warehouses
Related Products
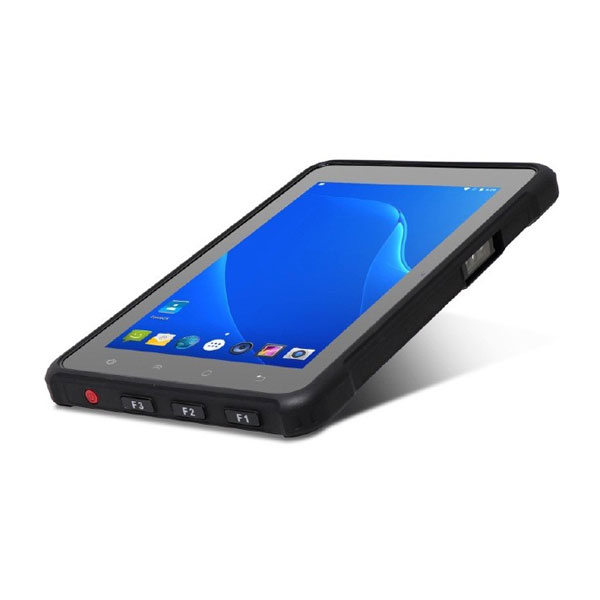
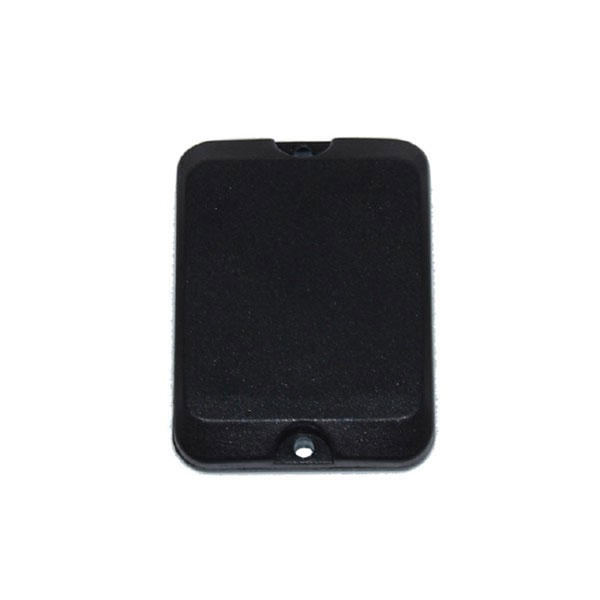



Manual operation costs include labor hours for searching, shipping errors, phantom inventory, and periodic inventory checks. For a 1000m² warehouse, these hidden costs can reach 80-120 million VND/year. In contrast, RFID reduces search time by 70-80% and nearly eliminates phantom inventory.
| Criteria | Manual Operation | RFID Location |
|---|---|---|
| Item search time | 10-15 minutes/occurrence | 1-3 minutes/occurrence |
| Phantom inventory rate | 5-10% | < 1% |
| Shipping errors | 2-5% | < 0.5% |
| Periodic inventory time | 2-3 days/month | 2-4 hours/month |
| Labor cost for searching | 30-40% of working time | 5-10% of working time |
For a more detailed comparison between the two methods, you can refer to the article comparing manual vs. RFID shipping control.
ROI calculation formula for RFID inventory location projects

ROI = (Annual benefits / Total initial investment cost) × 100%. Annual benefits include: reduced inventory value (typically 10-15%), saved labor costs, increased revenue from higher picking productivity, and reduced error handling costs.
Detailed formula to calculate ROI for an RFID inventory location & sorting project:
- Determine total initial investment cost: Includes hardware costs (fixed readers, antennas, RFID tags), management software, implementation, and staff training costs.
- Calculate benefits from reducing phantom inventory: Take average inventory value × 10-15% (typical reduction when applying RFID). Example: inventory of 2 billion VND, reduced by 12% = 240 million VND freed working capital.
- Calculate benefits from increased picking productivity: Number of pickers × average salary × 20-30% of time saved.
- Calculate benefits from reduced errors: Average order value × number of wrong orders per month × 12 months.
- Divide total benefits by total costs: The result is the ROI ratio. If ROI is above 50%/year, the project is worth investing in.
Real-world example: A distribution warehouse in Binh Duong has an average inventory of 3 billion VND, 10 pickers with a salary of 8 million VND/month, and processes 500 orders per month. After applying RFID, inventory decreased by 15% (450 million), picking productivity increased by 25% (saving 20 million/month), errors decreased from 3% to 0.5% (saving 15 million/month). Total first-year benefits: 450 + 240 + 180 = 870 million VND. With an investment cost of 600 million, ROI reaches 145% and the payback period is about 8 months.
What is the average payback period for an RFID inventory location system?
What is the average payback period for an RFID inventory location system?
The average payback period for an RFID inventory location system in Vietnam is 12-18 months. Larger warehouses (over 2000m²) with high-value inventory typically achieve payback faster, around 8-12 months, due to greater benefits from reducing phantom inventory.
Payback period
Cần tư vấn thiết bị/giải pháp cụ thể?
Việt POS phản hồi trong 30 phút · Hotline 4 vùng · Khảo sát miễn phí.
